
Breakdown views
Four views slice the same data different ways. Each accepts the same time range flags and output formats.
By model
Section titled “By model”cca models Claude Code usage · by model · all time
Model requests tokens cost share claude-opus-5 101 20.3M $37.87 62.3% claude-sonnet-5 111 20.3M $15.97 26.3% claude-haiku-4-5-20251001 128 19.4M $6.99 11.5%
Total 340 60.0M $60.82
─ Cost is what this usage would cost at API rates, not what you were billed; Claude Code on a subscription draws from your plan allowance instead.share is the percentage of the cost total, not of tokens — the two can
differ sharply, because a million Haiku tokens and a million Opus tokens cost
very different amounts.
By project
Section titled “By project”cca projects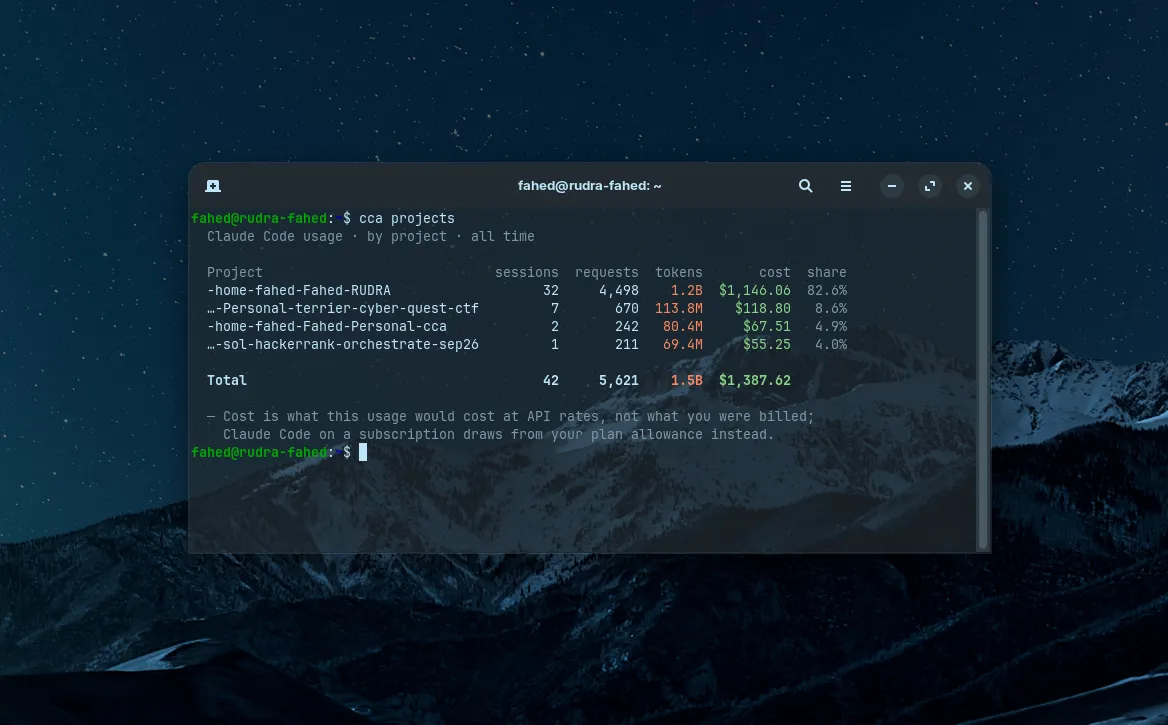
  Claude Code usage · by project · all time
  Project                  sessions  requests  tokens    cost  share  -home-dev-payments-api          4        95   17.6M  $25.51  41.9%  -home-dev-infra-scripts         4       117   20.2M  $20.88  34.3%  -home-dev-web-dashboard         5       128   22.1M  $14.43  23.7%
  Total                          13       340   60.0M  $60.82
  ─ Cost is what this usage would cost at API rates, not what you were billed;    Claude Code on a subscription draws from your plan allowance instead.
Project names are the slugified working directories Claude Code stores transcripts under. Long ones are shortened from the left, because the tail is what distinguishes them:
…-Personal-terrier-cyber-quest-ctfThe sessions column counts distinct conversations in that directory.
By day
Section titled “By day”cca daily Claude Code usage · by day · all time
Date requests tokens cost 2026-09-05 22 2.9M $1.65 2026-09-06 17 3.2M $4.33 2026-09-07 41 6.7M $6.05 2026-09-08 47 10.0M $8.98 2026-09-12 23 3.5M $2.38 2026-09-13 3 614.3K $0.54 2026-09-14 19 2.6M $2.89 2026-09-15 57 9.9M $15.02 2026-09-16 34 6.7M $4.64 2026-09-18 68 11.9M $13.11 2026-09-19 9 2.0M $1.22
Total 340 60.0M $60.82
─ Cost is what this usage would cost at API rates, not what you were billed; Claude Code on a subscription draws from your plan allowance instead.Rows are ordered oldest first, so the most recent day sits nearest your prompt. Days with no usage are omitted rather than shown as zero.
By session
Section titled “By session”cca sessions --top 10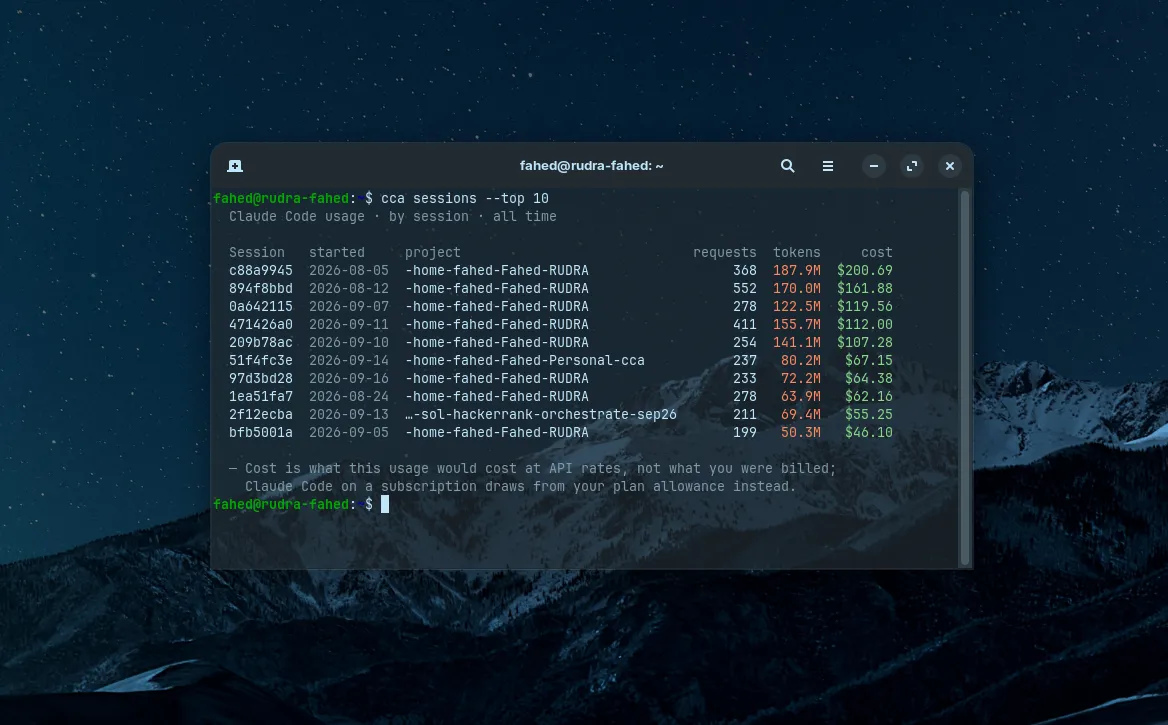
  Claude Code usage · by session · all time
  Session   started     project                  requests  tokens    cost  070d7109  2026-09-15  -home-dev-payments-api         38    7.1M  $11.09  7a3a8394  2026-09-08  -home-dev-infra-scripts        35    7.6M   $7.46  b82763ba  2026-09-07  -home-dev-infra-scripts        41    6.7M   $6.05  bee80626  2026-09-18  -home-dev-payments-api         26    4.9M   $6.03  a3a16d92  2026-09-16  -home-dev-web-dashboard        34    6.7M   $4.64
  ─ Cost is what this usage would cost at API rates, not what you were billed;    Claude Code on a subscription draws from your plan allowance instead.
Each session is shown with its title, so the table says what the work was rather than only which UUID it had. A session with no recorded name gets a dash. See Session titles.
Session identifiers are shortened to their first segment for the table. The
full identifier is available in --json and --csv, which is where you
would use it to find the transcript file.
--top N limits the rows; it defaults to 10 and does not change any total.
The water column is that session’s share of the estimate. Because water is a
flat rate per token, it is the token column in different units — it gives a
sense of scale, not a separate signal. --no-water hides it and brings back
the column it displaces (started with titles on, requests without). See
The water estimate.